
Moving averages: the trend, smoothed (and the golden cross myth)
मुभिङ एभरेज: गोल्डेन क्रस, डेथ क्रस र २०० दिनको औसत
A moving average smooths out the daily noise so you can see the trend. It's one of the most useful tools in charting - and the famous "golden cross" built on it is one of the least.
Smoothing out the noise
Daily prices jump around. A moving average irons out the jumps so the trend underneath is easier to see. The simple moving average (SMA) adds the last N closes and divides by N; tomorrow it drops the oldest close and adds the newest - it "moves". The exponential moving average (EMA) does the same but gives recent days more weight, so it turns a little sooner.
- Short averages (10, 20 days) follow price closely - quick, but jumpy.
- Long averages (50, 200 days) are smooth and slow - they show the bigger trend.
The average as a trend filter
The most useful way to use a moving average is also the simplest: is price above or below it, and which way is the average sloping?
- Price above a rising 200-day average → the long-term trend is up.
- Price below a falling 200-day average → the long-term trend is down.
- Price weaving through a flat average → no trend; averages are mostly noise here.
Many investors use this as a filter: "I only buy stocks above their 200-day average." It sounds sensible. Our NEPSE test, below, has a surprise.
The golden cross and the death cross
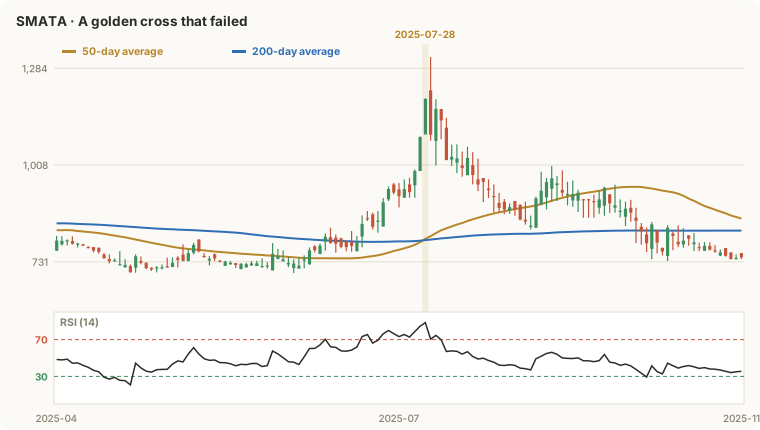
When the 50-day average crosses above the 200-day, it's called a golden cross - supposedly a buy signal. The opposite is a death cross. You'll see them in headlines. Think about what has to happen first: the 50-day only rises above the 200-day after weeks of rising prices. By the time the cross prints, much of the move has usually happened.
We found every golden cross, death cross, and every day above or below the 200-day average, on every listed company:
| After this... | Cases | Avg 20-day | Median | Up after 20 | +10% runs | −10% drops |
|---|---|---|---|---|---|---|
| Every day (the base) | 148,974 | +1.5% | -0.4% | 48% | 16% | 9% |
| Golden cross (50 above 200) | 534 | +0.3% | -2.2% | 37% | 16% | 12% |
| Death cross (50 below 200) | 529 | +0.2% | -0.8% | 44% | 9% | 6% |
| Any day ABOVE the 200-day | 81,178 | +1.0% | -0.8% | 44% | 16% | 11% |
| Any day BELOW the 200-day | 67,796 | +2.1% | +0.4% | 52% | 16% | 6% |
NEPSE daily data, 238 listed companies; signals from late 2022 (each needs a year of history first) to Oct 2026. Returns from the next session's open to the close 20 sessions later, before costs. Green = better than an ordinary day, red = worse. Past results don't guarantee future results.
- The golden cross did worse than an ordinary day on NEPSE: only 37% of cases were higher 20 sessions later, against 48% for any day. It arrived late, often near a short-term top.
- The death cross wasn't the disaster its name suggests - it also came late, often after most of the fall.
- In this period, stocks below their 200-day did better than stocks above it. NEPSE spent 2022-2023 falling and 2024 rallying hard: buying weakness worked better than buying strength. That won't always be true - but it shows a "rule" like "only buy above the 200-day" depends on the market's regime.
- Whipsaws: the average stock saw about 4.5 golden or death crosses in four years. Each one acted on means costs and a late entry or exit.

How to use moving averages properly
- As context, not a trigger. Use the slope and position to describe the trend; make decisions with other evidence.
- Expect lag. The longer the average, the later it confirms. That's the price of smoothness.
- Ignore crosses in flat, choppy markets - they're coin flips with costs attached.
- Mind adjustments. A bonus-share book closure drags a 200-day average down for months on an unadjusted chart.
See it live on MacroLens NP
Everything in this lesson, worked out on real NEPSE data for every listed company - inside the MacroLens NP desk.
Lesson summary
- A moving average is the average close over the last N sessions; the EMA weights recent days more.
- Price above a rising average = an uptrend in that timeframe; the average is a trend filter, not a trigger.
- Crosses come late by design: by the time the 50-day crosses the 200-day, much of the move is over.
- On NEPSE the golden cross did worse than an average day, and stocks crossed back and forth about 4-5 times in four years.
Create a free account to keep reading
Lesson 1 is open to everyone. From here on, the course is still completely free - we just ask for an account so we can save where you stopped, keep your quiz scores and let you pick up on any device.
No card, no payment. 9 more lessons, 89 minutes in all.
Education only, not investment advice: nothing here tells you to buy or sell any share. Investing carries risk - you can lose money. Examples use made-up companies unless a real one is named.