
Breakouts and 52-week highs: momentum, both ways
ब्रेकआउट र ५२ हप्ताको उच्च: सपोर्ट, रेजिस्टेन्स
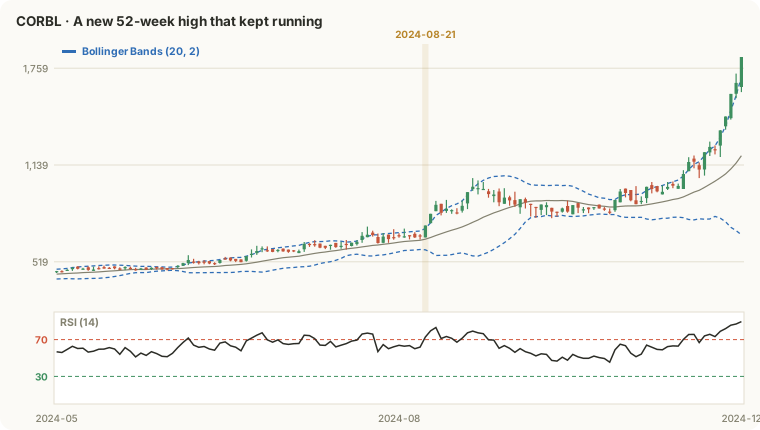
A stock at a new 52-week high scares beginners ("it's too high!") and excites momentum traders ("it's breaking out!"). NEPSE's data says both are partly right - and that the real lesson is about risk.
Why levels exist
Support is a price where buyers stepped in before; resistance is a price where sellers did. They exist because people remember prices. An investor who bought at Rs 600 and watched it fall to Rs 450 often sells the moment it gets back to Rs 600 - "just get me out at break-even". Enough people like that, and Rs 600 becomes resistance.
A breakout is a close beyond such a level. If price closes above Rs 600 and stays there, those "get me out" sellers are done - the ceiling is gone.
The 52-week high: no one left to get out
A stock at a new 52-week high has a special property: nobody who bought in the last year is sitting on a loss. There's no overhead crowd waiting to sell at break-even. That's why momentum traders love new highs - and why beginners fear them ("it's too high, it must fall").
What NEPSE's data says
| After this... | Cases | Avg 20-day | Median | Up after 20 | +10% runs | −10% drops |
|---|---|---|---|---|---|---|
| Every day (the base) | 148,974 | +1.5% | -0.4% | 48% | 16% | 9% |
| Close at a new 52-week high | 3,966 | +2.4% | -0.4% | 49% | 27% | 21% |
| ... liquid stocks | 3,464 | +2.1% | -0.8% | 47% | 27% | 23% |
NEPSE daily data, 238 listed companies; signals from late 2022 (each needs a year of history first) to Oct 2026. Returns from the next session's open to the close 20 sessions later, before costs. Green = better than an ordinary day, red = worse. Past results don't guarantee future results.
- New highs led to far more big runs: 27% gained 10%+ within 20 sessions, against 16% for an ordinary day.
- And far more big drops: 21% fell 10%+, against 9%. The median barely changed.
- So a new high isn't a "buy" or a "sell" - it's a wider range of outcomes. The breakouts that work can work spectacularly; the ones that fail fail hard. Everything depends on cutting the failures quickly.
How to trade breakouts with your eyes open
- Prefer closes, not wicks - a wick above resistance that closes back below is a failed test, not a breakout.
- Prefer liquid stocks and rising volume - thin-stock breakouts are easy to fake (lesson 7).
- Put the stop back below the broken level (and at least 2 ATR away) - if price falls back under the old ceiling, the breakout failed.
- Size from that stop - the fat downside tail is real.
- Consider the retest - waiting for price to come back and hold the old ceiling gives a closer stop, at the cost of missing some runs.
- Check the business - a new high on improving results is very different from a new high on a rumour.
See it live on MacroLens NP
Everything in this lesson, worked out on real NEPSE data for every listed company - inside the MacroLens NP desk.
Lesson summary
- Support and resistance are prices where buyers or sellers stepped in before; a breakout is a close beyond one.
- A new 52-week high means no one who bought in the last year is sitting on a loss - there's little overhead selling.
- On NEPSE, after new 52-week highs, big +10% runs were much more common than on an average day - and so were -10% drops.
- Breakouts reward a plan: a stop below the breakout level, position size from that stop, and patience for retests.
Create a free account to keep reading
Lesson 1 is open to everyone. From here on, the course is still completely free - we just ask for an account so we can save where you stopped, keep your quiz scores and let you pick up on any device.
No card, no payment. 9 more lessons, 89 minutes in all.
Education only, not investment advice: nothing here tells you to buy or sell any share. Investing carries risk - you can lose money. Examples use made-up companies unless a real one is named.