NEPSE crashes compared: how deep, how long, how fast the recovery

Every NEPSE investor remembers a fall that hurt. But how deep do NEPSE crashes usually go, how long do they last, and how long does the market take to win the losses back? We measured every fall of 10% or more in the NEPSE index in our daily history, from May 2022 to October 2026. The pattern is clear: falls come often, they come fast - and recoveries take far longer than the falls themselves.
How we measured a crash
We count a fall from a peak in the NEPSE index to its lowest point before the next rally, and keep only falls of 10% or more. For the biggest falls we also measured the recovery: the time from the bottom until the index climbed back above its old peak. All figures are for the index, not single stocks - individual shares often fall twice as far.
For context: our daily history starts in May 2022, already well into the long slide from NEPSE's 2021 peak near 3,200. That earlier fall - more than 40% from top to bottom - is the deepest in recent memory and sits mostly before the period measured here.
Every fall of 10% or more: a glimpse
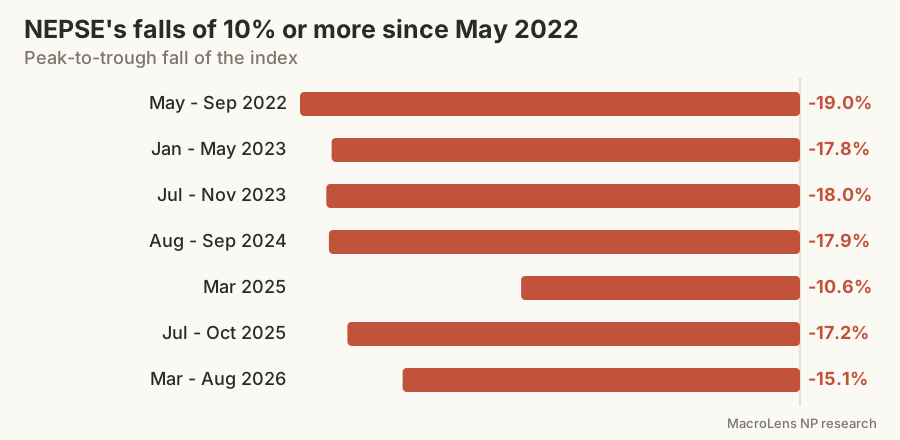
Seven times since May 2022 the index dropped 10% or more from a peak. Six of the seven were between 15% and 19% deep - NEPSE's typical "correction" is far bigger than the 10% people often expect. The three largest, measured from a high the index had not seen before:
| Fall | Depth | Time falling | Time to win it back |
|---|---|---|---|
| May - Sep 2022 | -19.0% | about 4 months | about 21 months |
| Aug - Sep 2024 | -17.9% | about 6 weeks | about 10 months |
| Jul - Oct 2025 | -17.2% | about 2 months | not yet back at the old high |
Three lessons from the falls
- Falls are fast; recoveries are slow. The 2024 fall took about six weeks; winning it back took about ten months. In 2022 the index needed almost two years to return to where the fall began.
- Deep corrections are normal, not rare. A drop of 15-20% has happened roughly every year. Plan for it, rather than treating it as a shock.
- The market can stay below its old high for a long time. As of October 2026 the index is still below its July 2025 peak of about 3,000, more than a year later.
What usually sets off a NEPSE fall
- Tighter money: higher interest rates, margin-lending limits or credit caps from Nepal Rastra Bank. See how interest rates move markets.
- Policy and tax changes: capital gains tax changes, or new trading rules.
- Political shocks and uncertainty over the budget.
- A rush of new supply: big IPO pipelines, right issues and promoter lock-ins ending - see our study of lock-in expiry.
- Froth: prices far ahead of earnings, often after heavy speculation in thin stocks - see the six crash warning signs.
How to prepare for the next one
- Don't invest money you'll need within a year or two - recoveries can take that long.
- Avoid heavy margin borrowing. A forced sale at the bottom turns a temporary fall into a permanent loss.
- Know how easily your stocks sell before a fall, not during one - see NEPSE liquidity.
- Keep some cash for buying good companies when everything is on sale.
The full study
This post shows only the headline numbers. The full study - every fall, which sectors fell furthest and recovered fastest, and how the strongest-rated stocks held up against the weakest - is inside the MacroLens NP desk, with live dump-risk readings for every company. Start your free 7-day trial, or sign in if you already have an account.
This is research on past prices, not investment advice. Past falls and recoveries don't predict the next one.
Source: MacroLens NP analysis of the NEPSE index, May 2022 - October 2026. Chart: MacroLens NP. Cover photo: public domain.