How interest rates move stocks, bonds and currencies: the US, Japan's carry trade and Nepal
When a central bank changes its interest rate, three markets move at once: stocks, bonds and the currency. Understanding how interest rates and the stock market are linked explains most of the big swings of the last five years - from Wall Street's worst year since 2008, to the day Japan's market fell 12% in a single session, to NEPSE's slump in 2022-23 and its jump in 2024. Here is how it works, with three real case studies and our own data for Nepal.
How an interest rate moves three markets
1. Stocks: money gets more expensive
A higher rate hurts shares in three ways. Companies pay more on their loans, so profits shrink. Investors can earn more from a fixed deposit or a bond, so shares have to offer more to compete - their prices fall until they do. And future profits are worth less today when money earns more elsewhere, which hits fast-growing companies (whose profits lie far in the future) hardest. Lower rates work the other way round.
2. Bonds: prices fall when rates rise
A bond pays a fixed interest. If you hold one paying 4% and new bonds start paying 6%, nobody will pay full price for yours - its price falls until its return matches the new rate. So when a central bank raises rates, the bonds people already hold lose value; when it cuts, they gain.
3. Currencies: money follows the higher rate
Global money flows toward the currency that pays more. When one country raises rates faster than others, investors buy its currency to earn that rate, and it strengthens. That is why a decision in Washington or Tokyo can change what a dollar costs in Kathmandu.
Case study 1: the United States in 2022
With inflation at its highest in decades, the US Federal Reserve raised its key rate from 0-0.25% to 4.25-4.5% in seven steps during 2022 - one of the fastest rises in its history. All three markets reacted exactly as the textbook says:

- Stocks: the S&P 500 fell 19.4% - its worst year since 2008 - and the tech-heavy Nasdaq lost 33%. Growth companies, whose profits lie furthest in the future, fell hardest.
- Bonds: the 10-year Treasury yield had its biggest annual rise in decades, ending the year near 3.9%. Rising yields meant falling prices: 2022 was one of the worst years on record for bond holders.
- Currency: the US dollar gained about 8%, its biggest annual rise since 2015. In Nepal, a US dollar went from about Rs 121 at the end of 2021 to about Rs 132 a year later - making imports, fuel and foreign debt dearer for Nepal.
Case study 2: Japan's carry trade squeeze, August 2024

For years Japan kept its interest rate at or below zero. That made the yen the world's cheapest currency to borrow. Traders borrowed yen at almost nothing and invested it in higher-paying assets abroad - US shares, US bonds, emerging-market currencies. This is the carry trade: you "carry" the gap between what you pay and what you earn.
It works only while the borrowed currency stays cheap. In March 2024 the Bank of Japan ended negative rates - its first rate rise in 17 years - and in July 2024 it raised its rate again, to about 0.25%. Tiny moves by global standards, but the yen began to strengthen, and weak US economic data then added to the pressure. Everyone who had borrowed yen suddenly owed more - and rushed to buy yen back by selling what they had bought with it.
On 5 August 2024, Japan's Nikkei 225 fell 12.4% in a single day - its largest points fall on record - after falling as much as 13.4% during the session. The selling spread to markets worldwide. The yen strengthened to around 143 per dollar. Markets bounced the next day, but the lesson stuck: a small rate change can cause a crash where a lot of borrowed money is built on that rate staying put.
Nepal: why the story works differently

Nepal's three channels are not the same as America's or Japan's:
- Currency: the Nepali rupee is pegged to the Indian rupee at a fixed rate, so Nepal Rastra Bank's interest rate does not move the exchange rate. What a dollar costs in Nepal follows the dollar against the Indian rupee - which is why the Fed's 2022 hikes reached Nepali importers.
- Bonds: government bonds and debentures are held mostly by banks and institutions; few retail investors trade them, so this channel matters less to individuals.
- Stocks: this is where Nepal's rates bite hardest. Much of NEPSE's buying is funded by bank loans, including loans against shares, and banks and financial institutions are a large part of the index. When bank money is cheap and plentiful, NEPSE tends to rise; when it is scarce and dear, NEPSE falls.
What our data shows

| Period | Interbank rate | Average lending rate | NEPSE |
|---|---|---|---|
| 2020 - early 2021 | near 0% (0.02% in Aug 2020) | - | the big 2020-21 bull run |
| Aug 2022 - Mar 2023 | 7.5-8.5% (bank rate 8.5%) | rising to about 13% | about 1,850-2,100 |
| Mid 2023 - mid 2024 | falls to about 3% | still 10-12% | stuck at about 1,850-2,150 |
| July 2024 | about 3% | down to about 10% | jumps to 2,761 (from 2,037 in June) |
| 2025-26 | about 2.75% (bank rate 5.75%) | about 6.5% | about 2,500-2,900 |
Two lessons stand out. First, NEPSE followed what banks charge borrowers, not the headline interbank rate: the interbank rate fell to about 3% in mid-2023, but NEPSE only rallied in mid-2024, once lending rates had come down. Second, cheap money is not enough by itself: with lending rates near their lowest in years in 2025-26, NEPSE has moved sideways - prices also need earnings to grow.
The three markets side by side
| United States 2022 | Japan 2024 | Nepal 2022-24 | |
|---|---|---|---|
| Rate move | 0% → 4.5%, seven hikes | below 0% → about 0.25% | rates up to 8.5% (bank rate), then cut |
| Stocks | S&P 500 -19%, Nasdaq -33% | Nikkei -12.4% in one day | NEPSE fell, then rallied as lending rates fell |
| Bonds | big losses as yields jumped | yields rose from near zero | mostly held by banks |
| Currency | dollar +8% | yen surged as carry trades unwound | pegged to the Indian rupee; moved with the dollar |
| The lesson | fast hikes hit growth shares hardest | small moves crash leveraged trades | watch bank lending rates and liquidity |
What to watch as a NEPSE investor
- Nepal Rastra Bank's monetary policy - announced each year around July-August, with reviews during the year: the policy rate, the corridor around it (the bank rate is its ceiling), and any rules on loans against shares.
- Bank lending and deposit rates - the rates that actually reach investors' loans. Falling lending rates have come before NEPSE rallies.
- The interbank rate and liquidity - an early signal: when banks have spare money, it tends to find its way into lending, and into shares.
- The US Federal Reserve - through the dollar, it changes what Nepal pays for imports and the value of remittances in rupees.
MacroLens NP tracks Nepal's interest rates, inflation, remittances and reserves month by month on the Nepal economy page. To see how individual stocks would weather higher rates, start with each company's debt and earnings on its free stock page, or browse every listed company by sector. For how banks' earnings can mislead, see the warning signs before a NEPSE stock crashes.
This is research, not investment advice. Past results don't guarantee future results.
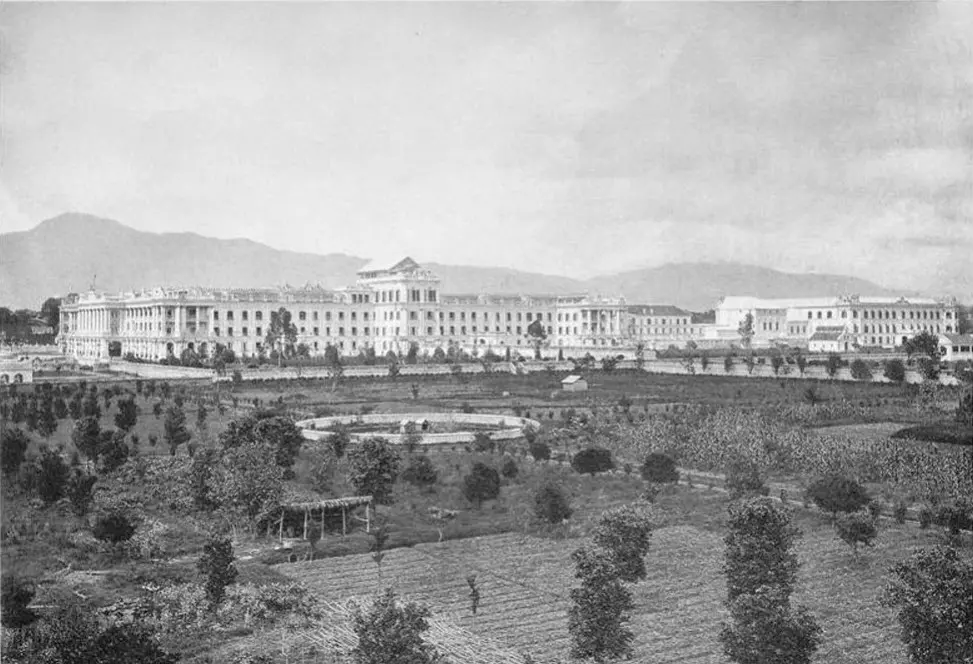
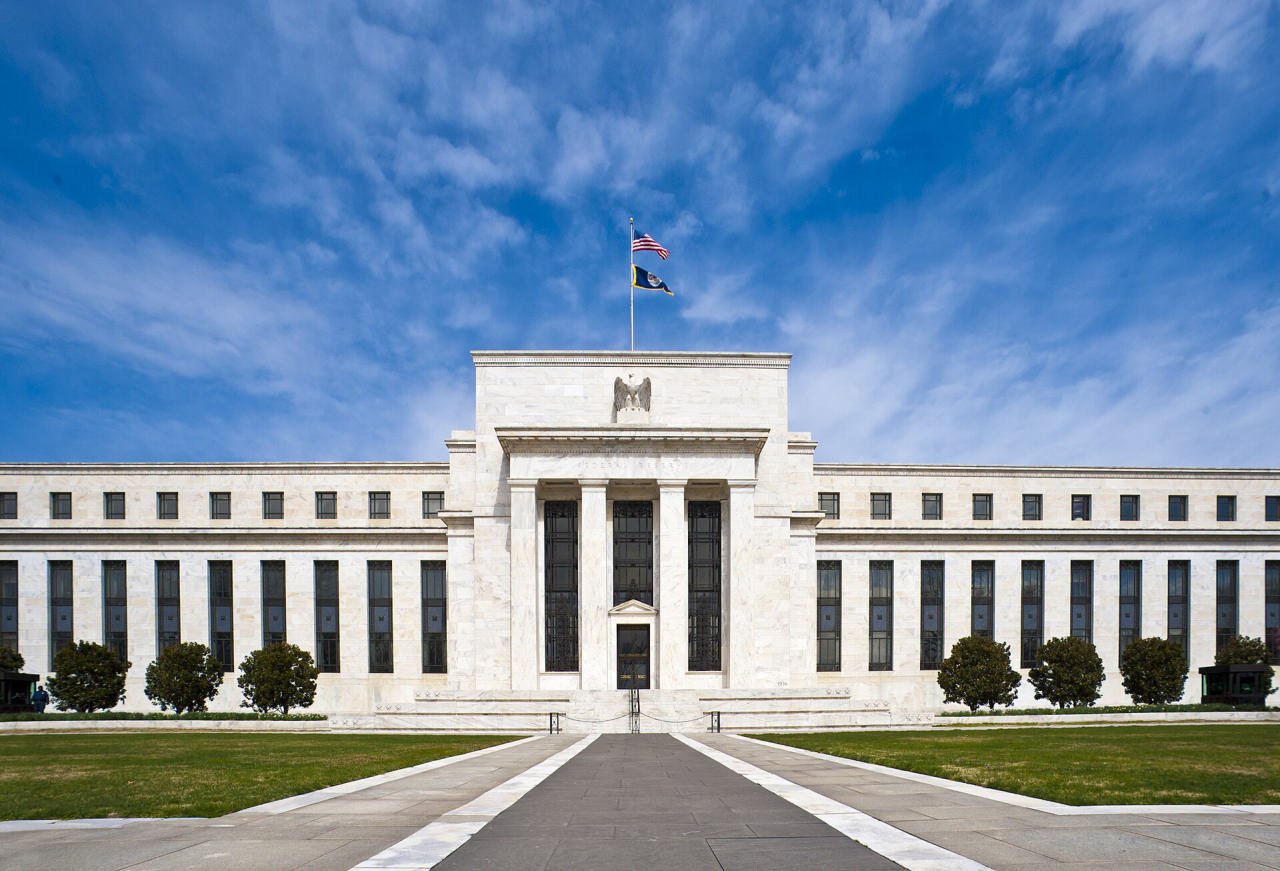
Photos via Wikimedia Commons: cover - the Eccles Building, US Federal Reserve (public domain, Federal Reserve); Bank of Japan building by Syced, CC0; Nepal Rastra Bank by Clemensmarabu, CC BY-SA 3.0. Nepal rates: Nepal Rastra Bank data via the IMF.