6 warning signs before a NEPSE stock crashes (and how often they were right)

Most NEPSE investors who lose big don't lose on bad luck - they buy just before a fall that left clues. We built a dump risk score from those clues and tested it on NEPSE history using only what was known on each day. Here are the warning signs that come before a NEPSE stock crash, and how often they've been right.
First, the base rate
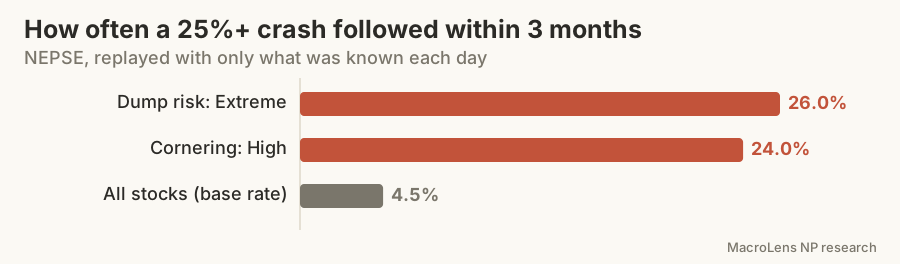
We call a crash a fall of 25% or more within three months. Across NEPSE stocks, about 4.5% of readings were followed by one. Every warning sign below is measured against that number: a sign is only useful if it raises the odds well above 4.5%.
Sign 1: the price is far above what the company is worth
We estimate a fair-value band from four methods - the Graham number, ROE-justified price-to-book, and what sector peers pay on earnings and on book value. A stock trading 60% or more above the middle of that band carries the full overvaluation weight in the score. Valuation alone rarely times a fall, but it decides how far a stock can drop when sentiment turns.
Sign 2: a big run-up in a short time
A price far above its own 180-day average - 50% or more scores the maximum - means a lot of buyers are sitting on fast gains and are ready to take them. Combine that with a stock near its 52-week high and the room for disappointment is large.
Sign 3: weak fundamentals behind a strong price
Falling profits, a thin capital base, rising bad loans in a bank or microfinance - when the price climbs while the business weakens, the gap usually closes from the price side. The free stock pages show each company's key figures quarter by quarter.
Sign 4: the headline EPS hides something
Our forensic checks look for what a reported profit can hide: provision write-backs that flatter a bank's earnings, income from outside the core business, dividends larger than what the company earns, and debt it can't service. Each red flag adds to the risk; a company can look cheap on P/E precisely because its earnings won't repeat.
Sign 5: thin trading
A stock that trades little can be pushed up easily - and falls hard when buyers step back, because there's no one to sell to. See how to check whether a stock is easy to sell.
Sign 6: a few brokers own the float
From four years of floorsheets we measure how much of a stock's tradable shares a handful of brokers have accumulated. When a few hold most of the float, the price is in their hands - and when they sell, there's often no one on the other side.
How often the signs were right
| Reading | Crashed 25%+ within 3 months | All stocks | Readings |
|---|---|---|---|
| Dump risk: Extreme | 26% | 4.5% | 599 (tested out of sample) |
| Cornering: High | 24% | 4.5% | 6,972 (2023-2026) |
An Extreme dump risk reading made a crash about six times more likely than for the average stock. Note what that also says: three in four Extreme readings did not crash within three months. These are odds, not certainties - a reason to size smaller, set a stop or wait, not a guarantee of a fall.
Two more patterns worth knowing
- Chasing circuits: buying the morning after an upper circuit has trailed NEPSE by about 3.8% over the next 20 sessions - see the full test.
- New listings after their first month: the typical IPO fell about 33% from its first-year peak - see the IPO study.
Put it into practice
Before you buy, run through the six signs - or see them scored for every listed company on MacroLens NP, with each reading's own track record on the track record page. Start with the free top-rated stocks and NEPSE today.
This is research, not investment advice. Past results don't guarantee future results.
Cover photo: Sunrise over the Himalaya by Harald Hoyer, CC BY-SA 2.0, via Wikimedia Commons.