Is SIP in Nepal worth it in 2026? The 15-20% promise vs the real returns
Scroll through Nepali finance videos and posts for ten minutes and you will hear the same promise: start a SIP in Nepal, put in a few thousand rupees a month, and "earn 15-20% a year". Some go further - "SIP never loses money", "better than any fixed deposit, guaranteed". We checked that promise against every number we could find: the published returns of Nepal's SIP funds, the full records of all 28 closed-end mutual funds with three or more years behind them, and our own test of a monthly SIP in every NEPSE stock since 2019. The answer is not that SIP is bad. The answer is that nobody in Nepal has delivered 15-20% a year through a SIP, and anyone who promises it is selling you a dream.
First, what a SIP is - and is not
A SIP (Systematic Investment Plan, नियमित लगानी) means investing a fixed amount at regular times - say Rs 5,000 on the 1st of every month - usually into a mutual fund, sometimes directly into shares. It has two genuine advantages:
- Discipline. Money goes in every month, before you can spend it or second-guess the market.
- Averaging. The same rupees buy more units when prices are low and fewer when they are high, so you never put everything in at the top.
What a SIP is not is a source of return. A SIP is a way of buying. The return comes entirely from what you buy - the fund or the shares - and from the economy behind them. If those grow 5% a year, your SIP earns about 5% a year, however regular it is. That one fact is what the "15-20%" sales pitch hides.
What Nepal's SIP funds have actually returned
Nepal has around 14 open-ended funds that offer SIP plans. Their own track records, as published by the comparison site nepsestock.com in November 2025, look nothing like the promise:

| SIP fund | Age (Nov 2025) | Yearly return since launch | Last 12 months | NAV, Oct 2026 |
|---|---|---|---|---|
| NIBL Sahabhagita Fund | 6 years | 10.7% | -6.5% | Rs 10.31 |
| Kumari Sunaulo Lagani Yojana | 3 years | 10.4% | -1.5% | Rs 11.35 |
| Shubha Laxmi Kosh | 3 years | 8.0% | -0.2% | Rs 10.06 |
| NIC Asia Dynamic Debt Fund | 5 years | 7.9% | -3.4% | Rs 9.96 |
| Nabil Flexi Cap Fund | 3 years | 5.7% | -2.9% | Rs 10.30 |
| Siddhartha Systematic Investment Scheme | 4 years | 2.1% | -1.9% | Rs 10.98 |
| NMB Saral Bachat Fund - E | 4 years | 1.2% | -4.6% | Rs 10.31 |
Not one fund is near 15%. Every one of them lost money over the twelve months to November 2025. And most still trade within a rupee of the Rs 10 they started at - after years of investors' monthly contributions. (These SIP-fund figures are third-party calculations; check each fund manager's own reports before relying on any single number.)
Seven years of mutual funds: our own numbers
Closed-end mutual funds are the longest public record of professional fund management in Nepal. We took all 28 that have at least three years of history, followed each fund's NAV from launch to October 2026 from our own weekly records, and added back every cash and bonus dividend it paid:
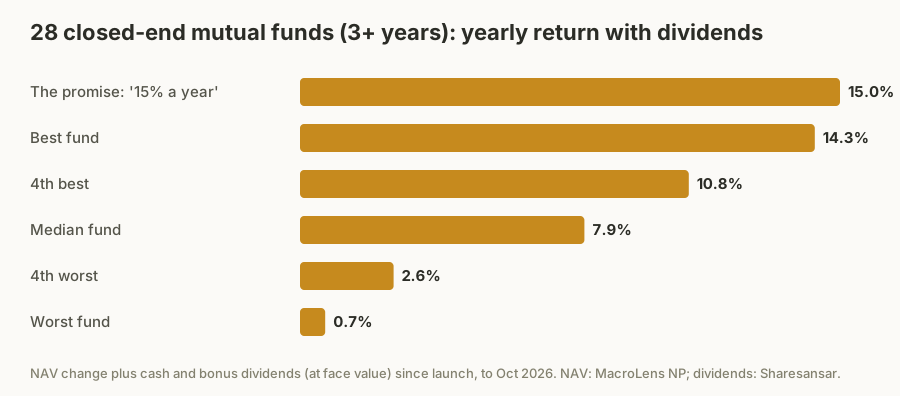
- Median: 7.9% a year including dividends.
- Best: 14.3% a year (Prabhu Smart Fund, 3.5 years), then Himalayan 80-20 at 13.6% and Sunrise First Mutual Fund at 11.7% over almost seven years.
- Zero funds reached 15% a year. Only four passed 10%.
- Ten of 28 returned under 5% a year - less than a fixed deposit paid for much of that time. The weakest, NIBL Samriddhi Fund 2, returned 0.7% a year over more than five years.
That is not a disaster. Eight percent a year, steadily, is a reasonable result in Nepal's market. But it is half of what is being promised, and it comes with years like 2025 when almost every fund fell.
Seven years of NEPSE prices: a SIP in every stock
Funds are one way to SIP. Many people now run a SIP straight into shares. So we ran one in every NEPSE stock: Rs 5,000 on the first trading day of every month, whole shares only, real broker commission and SEBON fee on every purchase, valued at the October 2026 close. We started it in each year from 2019 to 2024 and counted every stock that was listed the whole time (stocks whose price history had an unadjusted bonus or right issue were left out, so bad data could not flatter or hurt the result).
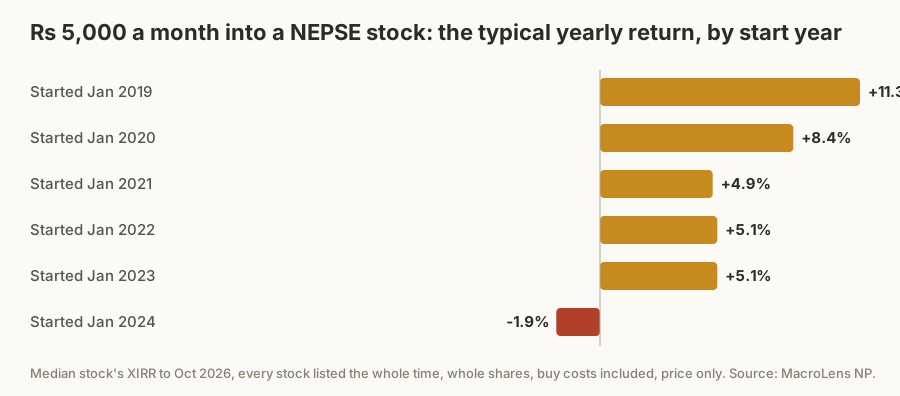
| SIP started | Months | Stocks | Typical stock, per year | Stocks that lost money | Stocks at 15%+ a year | NEPSE index SIP, per year |
|---|---|---|---|---|---|---|
| Jan 2019 | 93 | 88 | +11.3% | 8% | 34% | +7.5% |
| Jan 2020 | 81 | 102 | +8.4% | 16% | 25% | +5.7% |
| Jan 2021 | 70 | 123 | +4.9% | 26% | 15% | +3.7% |
| Jan 2022 | 58 | 141 | +5.1% | 28% | 17% | +5.4% |
| Jan 2023 | 46 | 167 | +5.1% | 30% | 21% | +6.2% |
| Jan 2024 | 34 | 201 | -1.9% | 55% | 14% | +3.2% |
What this says, plainly:
- The best case was about 11% a year - and it needed a start in 2019, just before the 2020 crash and the 2021 boom. Even then, only about a third of stocks reached 15% a year.
- Any start since 2021 gave the typical stock about 5% a year or less - roughly what a bank deposit paid for much of that time.
- Short SIPs lose often. More than half of the SIPs started in January 2024 were still losing money in October 2026. A SIP needs years, not months.
- The sector mattered more than the habit. From 2019, hydropower and development-bank stocks returned about 16-17% a year for the typical stock, commercial banks under 6%. From 2024 it was the other way round: banks about 13%, hydropower slightly negative. Nobody could have known in advance which would lead.
- The NEPSE index itself returned 3-7.5% a year through a monthly SIP, depending on the start. There is no fund in Nepal that simply tracks it - but if there were, that is what it would have paid.
One caution makes these numbers, if anything, too kind: they only include companies still listed today. Companies that merged away or collapsed are missing, and they rarely had good endings. Cash dividends are not included, which works the other way and adds perhaps one to three points a year for dividend-paying stocks.
Why the numbers are what they are: Nepal's economy right now
Share prices follow company profits over time, and company profits follow the economy. Nepal's economy in 2026 is stable but slow:
- Growth is modest. The economy grew about 2% in 2023 and about 4.4% in 2025 (World Bank). Company profits cannot compound at 15-20% for long in an economy growing at 4%.
- Credit has been weak. Banks - the biggest part of NEPSE - earn by lending. After the 2022-23 rate shock, borrowing stayed subdued, and bank profits with it.
- Interest rates have collapsed. The average deposit rate fell from about 8.5% in early 2023 to about 3.2% in August 2026; lending rates from about 13% to 6.5% (Nepal Rastra Bank data via the IMF). Low rates push savers toward shares and funds - which lifts prices for a while, not profits.
- The economy runs on remittances. Money sent home by workers abroad reached about 32% of GDP in 2025. It fills bank deposits and spending, but it does not build the factories and services that grow listed companies' earnings.
In that economy a long-term return of about 5-10% a year from a diversified fund is realistic. 15-20% is not - unless you happen to start at the bottom of a crash, which nobody can plan.
Domestic case study: the 2021 bubble and the people who bought it
The "SIP gives 15-20%" story was born in 2020-21. Interest rates were low, NEPSE more than doubled in about a year, from about 1,340 in mid-2020 to 3,199 on 18 August 2021. Funds launched in that period showed spectacular early returns, and those numbers spread on social media as if they were normal. Then rates jumped and NEPSE fell 43% in thirteen months, to about 1,815 in September 2022. Several funds launched in 2021 are still below their Rs 10 launch price five years later, and even counting every dividend they returned under 3% a year (NIC Asia Select-30, Mega Mutual Fund 1, Sunrise Bluechip Fund, NIBL Samriddhi Fund 2 in our table). A SIP started at the top of 2021 would have spent years under water. The averaging helped - it always does - but it did not create the promised return.
Global case studies: when "it always goes up" was wrong
- Japan, 1989. The Nikkei 225 peaked at about 38,900 in December 1989 and did not regain that level until 2024 - 34 years later. A Japanese investor running a SIP through the 1990s and 2000s eventually made money thanks to averaging, but for a very long time far less than any advert would have promised.
- The United States, 2000-2009. America's S&P 500 ended the decade roughly where it started - the "lost decade". A monthly investor still came out slightly ahead because of cheap buying in 2002 and 2009, but nowhere near the 10-12% a year that US markets are famous for over the very long run.
- India, the SIP superpower. India built the world's largest SIP industry, and its regulator SEBI had to step in: in March 2023 it told mutual funds to stop advertisements and brochures that implied assured or fixed returns. India's experience is the template Nepal is copying - including the marketing problem.
Every one of these markets eventually rewarded patient investors. None of them rewarded people who believed a guaranteed number.
The industry problem: who is selling you the dream
SIP is a good habit. The problem is how it is being sold in Nepal:
- Promises nobody can keep. A mutual fund cannot guarantee a return. Posts and videos that say "15-20% a year" - or "SIP never loses" - are making a promise that no fund in Nepal has ever met over its life.
- Promotion that does not say whether it is paid. Fund managers and issuers spend money on marketing, and paid campaigns and referral deals with finance content creators are common around the world. If the person telling you to invest is paid for it, you deserve to know - and most posts do not say either way.
- Costs that are never mentioned. A fund charges a yearly management fee (up to about 1.5% of the fund) plus depository, supervisor and other charges; older funds' total yearly costs have been reported at around 4.5% of fund size (Sharesansar). Many SIP plans also charge an exit load if you leave within a year or two. Every rupee of cost comes straight out of your return, year after year.
- Cherry-picked periods. "This fund made 35%" is usually one good year, quoted without the bad ones.
What would make high returns realistic
For fund companies and the regulator:
- Publish one standard number. Every fund should show its total return including dividends - for one, three and five years and since launch - in the same format, next to the NEPSE index, so investors can compare honestly. SEBON could require it.
- Ban return promises and require "paid" labels. As India did in 2023: no assured-return language in any advert, and any promotion paid by a fund or issuer clearly marked.
- Lower the costs. At 2-4% a year in costs, a fund needs a strong market just to stand still. Cheaper funds, and an index fund or ETF that simply tracks NEPSE, would leave more of the return with savers.
For the economy, sustained 12-15% stock returns would need sustained 12-15% growth in company profits. That means steady credit growth into productive businesses, faster economic growth than the 2-5% of recent years, power exports and manufacturing that earn foreign money, and a deeper market with more real companies listed - not just more banks, microfinance and hydropower projects. Until that happens, high returns will come in bursts - and the bursts will be followed by falls.
So, is SIP in Nepal worth it in 2026?
Yes - if you treat it as a habit, not a promise:
- Expect about 5-10% a year over the long run, with losing years along the way. That is still better than today's 3% deposit rates, and it is what Nepal's funds have actually delivered.
- Plan for five years or more. Two-year SIPs lost money in our tests far more often than five-year ones.
- Check the costs and the exit load before you sign, and compare the fund's real returns including dividends - not the one good year in the advert.
- If you SIP into shares yourself, choose carefully. What you buy matters more than how often - see our test of a weekly SIP in NEPSE stocks using our ratings.
- Be suspicious of anyone who promises a number. The more certain the promise, the more likely it is a sales pitch.
Try it on real prices with our free SIP calculator - any stock, any dates, monthly or weekly - and see for yourself what a SIP would have done.
This is research, not investment advice. Fund figures from third parties may contain errors; always check a fund's own reports. Past returns do not predict future ones.
Sources - our data (MacroLens NP): closed-end fund NAVs (weekly, since launch), daily stock prices, economy series (World Bank, IMF / Nepal Rastra Bank). From the web: SIP fund returns as listed by nepsestock.com (Nov 2025); SIP fund NAVs from hamroshare.com.np (Oct 2026); fund dividends from Sharesansar; fund costs from Sharesansar and fund disclosures; SEBI's March 2023 direction as reported by Business Standard. Charts: MacroLens NP. Cover photo: Prasna Siwakoti, Wikimedia Commons, CC BY-SA 4.0.