What is circular trading? Volume manipulation on NEPSE, explained
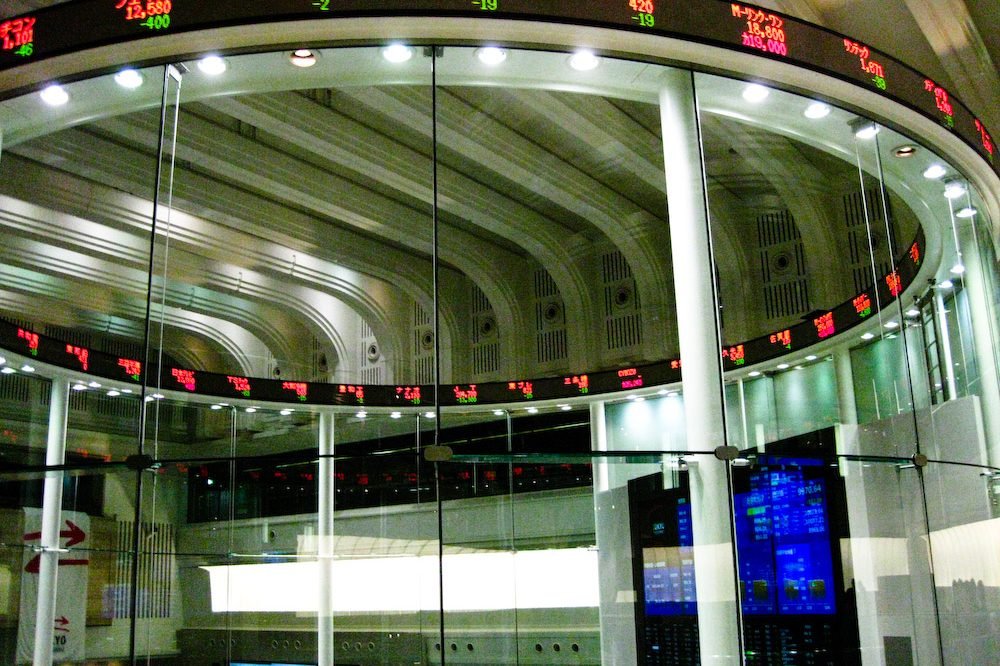
A thinly traded stock suddenly shows heavy volume, the price climbs, and new buyers rush in - only for the price to fall back once the volume dries up. Often the cause is circular trading: the same group buying and selling shares among themselves to manufacture activity. This guide explains how circular trading and volume manipulation work on NEPSE, what the regulator has found, what our own floorsheet data shows, and the warning signs you can check yourself.
What circular trading is
Circular trading means a group of traders passing the same shares back and forth - A sells to B, B sells to C, C sells back to A - at prices they agree on. No real ownership changes hands, but every trade adds to the day's volume and can step the price up. Wash trading is the one-person version: a trader sells to an account they control, such as a relative's, and buys the shares back.
SEBON's own investor handbook describes the wash sale exactly this way: a person sells shares to a family member and buys them back the same day, "to create an illusion of trading activity", so that other investors join in and the price rises - and then the manipulator sells at the higher price. It lists wash sales alongside market cornering, broker churning and pump-and-dump as activities that distort the market.
Why fake volume works
- Volume looks like interest. Many investors read rising volume as a sign that "big money" is buying, and follow it.
- Screeners and top-turnover lists amplify it. A stock that jumps into the most-traded list gets seen by thousands more people.
- Small floats are easy to move. Where only a small share of a company's stock is held by the public, a group with a few crore rupees can dominate trading.
- It ends with distribution. The real goal is to sell the group's shares to the new buyers the volume attracted - the "dump" in pump-and-dump.
What the regulator has found
- June 2021: SEBON published a list of 51 companies whose prices had risen by more than 300% in a year, some with P/E ratios above 100 or negative earnings. It said it had found indications of insider trading, circular trading and cornering, and started a detailed study.
- April 2026: SEBON's supervision reports alleged a coordinated network around a group of insurance companies and a broker: shares were allegedly bought and sold within the same network at rising prices, creating false demand, with one reinsurer's share pushed from about Rs 1,461 to Rs 1,686. SEBON classed several of the actions as fraudulent transactions under Section 98 of the Securities Act, 2006 and referred the case to Nepal Police. These are allegations, not court findings.
- The same month, SEBON suspended a stock broker's licence over financial irregularities, and police asked for details of brokers handling very large daily volumes.
What our floorsheet data shows
The NEPSE floorsheet lists every trade with its buying and selling broker. It does not show client names, so nobody outside the brokers and the regulator can prove circular trading from it - but it does show the patterns. We measure two:
- Cross trades: the same broker on both sides of a trade.
- Ping-pong: two brokers trading the same stock back and forth with each other on the same day.
| Measure (NEPSE floorsheet) | Value |
|---|---|
| Trades analysed, 30 Sep - 13 Oct 2026 | 461,471 trades, Rs 42.1 billion |
| Same broker on both sides | 3.1% of trades, 4.5% of turnover |
| Typical stock: cross-trade share (median, 425 stocks, 20 sessions) | 2.5% of shares traded |
| Top 10% of stocks: cross-trade share above | 8.8% |
| Stocks where more than 20% / 30% of volume was cross trades | 14 / 8 |
| Typical ping-pong share (median / top 10%) | 0.9% / above 6.5% |
By sector, cross trades were most common in finance companies (9.2% of turnover), microfinance (7.0%), manufacturing (6.9%) and life insurance (6.7%) - smaller, thinner sectors - against 4.0% in commercial banks and 3.5% in hydropower.
Be careful with this number. A cross trade is usually innocent: a large broker has thousands of clients, and two of them buying and selling the same stock is normal. The red flag is a stock where cross trades or ping-pong are many times the usual level, day after day, while the price climbs. That is why our cornering and floorsheet pages flag a stock only when its cross-trade share passes 15% or its ping-pong share passes 12% - several times the typical level.
Warning signs you can check
- Volume with no news. Turnover jumps many times its usual level with no results, dividend, bonus or announcement behind it.
- A few brokers on both sides. On the floorsheet, the same two or three brokers appear as both the top buyers and the top sellers.
- Same-size trades, step-by-step prices. Rows of equal quantities, each a rupee or two higher than the last.
- Price far above value. A P/E far above its sector, or a price many times its book value, with weak or negative earnings.
- Social-media tips pushing the same thinly traded stock at the same time.
- Volume that vanishes. Once the price has run up, trading suddenly thins out - and you may not be able to sell near the top.
How to protect yourself
- Check who is buying and selling on the floorsheet and the cornering readings before chasing a volume spike.
- Look at the company's fundamentals and fair value on its stock page, and the six crash warning signs.
- Check how easy the stock is to sell - see NEPSE liquidity - and be wary of chasing an upper circuit.
- If you suspect manipulation, you can report it to SEBON, which supervises trading and brokers.
This is general information, not investment advice, and it accuses no company, broker or person. Floorsheet patterns are signs worth checking, not proof of wrongdoing.
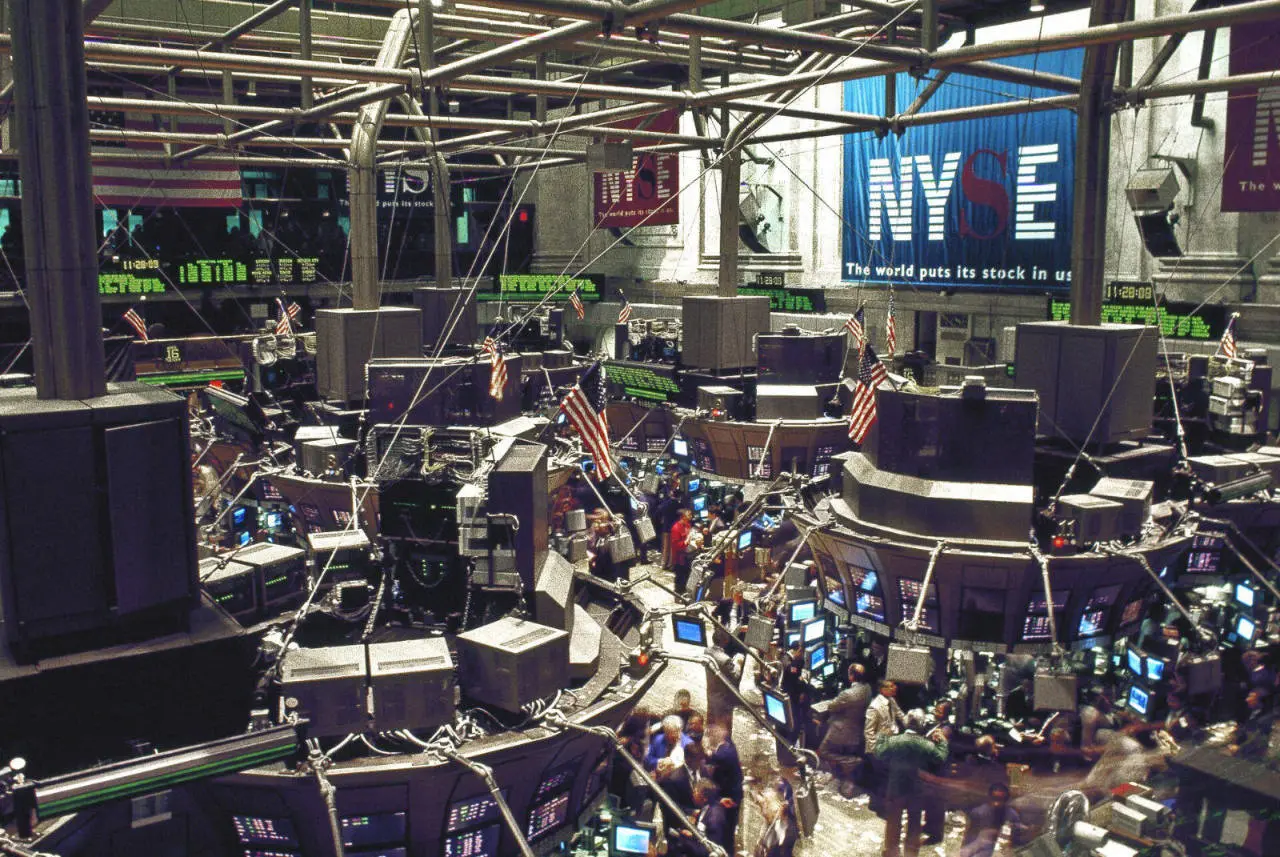
Sources: SEBON Investors' Handbook; The Himalayan Times (15 June 2021); SEBON supervision reports as reported by NEPSE Trading and others (April 2026); MacroLens NP analysis of the NEPSE floorsheet, 14 September - 13 October 2026. Cover photo: Market centre in Tokyo stock exchange by ehnmark, CC BY 2.0, via Wikimedia Commons.